+49 30 6392 7816


PHARMACEUTICAL PRODUCTION

ABOUT

In-line spectroscopy has numerous applications in the manufacture of drug substances and OSD drug products. ColVisTec’s industrial spectrometers are designed for robustness and reliability and can support pharmaceutical manufacturing campaigns by providing 100% product analysis and documentation.

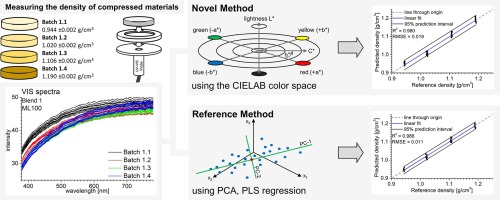
Our spectroscopic techniques can be applied to solids, liquids, solutions, melt phases and amorphous solid dispersions, including intermediate and finished products. Monitor and quantify water-content, API content, crystallinity & dispersion, API degradation, tablet density and hardness - all in real-time.

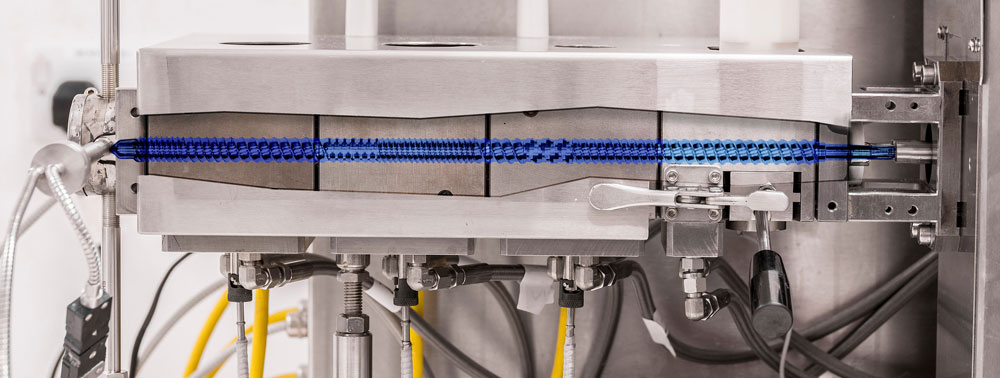
In-line monitoring is an invaluable tool in process development and for rapidly exploring the design space. For ASD hot-melt extrusion processes, UV/Vis can characterise critical process parameters relating to the extruder and peripheral equipment (e.g. residence time, feed rate & consistency, drug dissolution & homogenisation).


UV/VIS SPECTROSCOPY IS A MULTI CQA PAT TOOL


img

  • Instantly detect in-process deviations and drift
  • Accurately quantify API / polymer degradation
  • Prevent out-of-spec production and batch contamination
  • Detect residual API crystallinity
img

SWITCH TO IN-LINE SAMPLING – THE ADVANTAGES ARE CLEAR


APPLICATIONS & RECENT PUBLICATIONS

Examples using our technology

img      Paper

In-Line UV/Vis Spectroscopy as a Fast-Working Process Analytical Technology (PAT) during Early Phase Product Development Using Hot Melt Extrusion (HME)

This paper explores the use of an in-line PAT system in pharmaceutical continuous manufacturing using Hot Melt Extrusion (HME) and UV–Vis spectroscopy within a QbD framework. The study, employing a sequential DoE, investigates the effects of process parameters on critical quality attributes for Piroxicam - Kollidon® VA64 dispersions. Statistical analysis revealed interaction effects, with solid feed rate significantly affecting absorbance. Optimal extrusion conditions are determined as 20% w/w PRX, 140 °C temperature, 200 rpm screw speed, and 6 g/min feed rate. In-line UV/Vis can detect drug oversaturation (>20% w/w).

Schlindwein et al. Pharmaceutics 2018, 10 (4), 166

Study

UV/Vis spectroscopy as an in-line monitoring tool for tablet content uniformity

This study focuses on in-line UV/Vis spectroscopy for real-time monitoring of API content in tablets during continuous manufacturing.

The experiments, conducted on a rotary tablet press, involved tablets with theophylline monohydrate (7–13 wt%), lactose monohydrate, and magnesium stearate. The UV/Vis probe, positioned at the ejection point, measured the tablet sidewall. Validation, following ICH Q2 guidelines, confirmed specificity, sufficient linearity (coefficients of determination: 0.9891 for low throughput, 0.9936 for high throughput), and acceptable repeatability (max 6.46%) and intermediate precision (max 6.34%).

Brands et al. Journal of Pharmaceutical and Biomedical Analysis Volume 236, 30 November 2023, 115721
     img

img      Paper

UV–VIS spectra as potential process analytical technology (PAT) for measuring the density of compressed materials: Evaluation of the CIELAB color space

This paper presents a novel method using UV/Vis spectrophotometry to determine the density of sample compacts, a critical quality attribute in material processing. By analyzing visible range spectra, color information was calculated and found to be directly proportional to compact density. Comparison with PLS regression showed both methods predicted density with identical accuracy. The direct correlation of color information with density, as an output parameter, required no extensive data pre-processing, making it a potentially efficient process analytical technology tool for implementing into compression processes such as tableting or roller compaction.

Lillotte et al. International Journal of Pharmaceutics Volume 603, 15 June 2021, 120668

Study

Novel Cleaning-in-Place Strategies for Pharmaceutical Hot Melt Extrusion

This study addresses pharmaceutical equipment cleaning challenges in hot melt extrusion (HME). Two cleaning approaches are explored after processing polymeric formulations of hormonal and poorly soluble drugs. In-line UV–Vis spectroscopy quantifies very low API concentrations during cleaning, and a novel solvent-based method was developed and compared to a polymer-based one. Results showed the solvent-based approach effectively removes API residue from most equipment areas, suggesting its potential for comprehensive API cleaning-in-place for pharmaceutical extruders.

Spoerk et al. Pharmaceutics 2020; 12(6):588
      img

OPTICAL PROBE INSTALLATION & OPERATION

HOW WE ASSEMBLE OUR TECHNOLOGY

Reflectance and Transmission probes can be installed semi-permanently into any existing flow process with no system perturbation. Our probes can be calibrated and re-calibrated in situ, without interrupting the flow process.

Our spectrometers can be located up to 20 metres away from the point of measurement and can monitor two independent production lines at any one time; i.e. two distinct positions within one production line, or two independent production lines.

Continuously measure product quality and CPPs every second - from start-up to clean-down.

Maximize process efficiency, stability and reproducibility, whilst minimising waste.


img

EXAMPLES FROM OUR CUSTOMERS

USING OUR TECHNOLOGY INLINE

img      PROCESS DEVELOPMENT IN EXTRUSION

INNOVATIVE, EASY, AND FAST RESIDENCE TIME DETERMINATION

  • • Very short measurement interval of 500 ms
  • • Detection of residence time significantly faster and less cumbersome than old methods
  • • Simpler and faster than off-line chromatography or the "ash" method
  • • Enabled by ColVisTec's ReTA software
PROCESS DEVELOPMENT – R&D

IN-SITU RESIDENCE TIME DETERMINATION

  • • For HME, a coloured tracer or API can be used to observe mixing, dissolution kinetics and residence time
  • • Instantly observe the impact of changing screw speed, feed-rates and temperature gradients
  • • Measure API and polymer thermal stability and degradation kinetics
  • • Timeframe of the inline measurements including data analysis: few Minutes; timeframe of the chromatography measurements including data analysis: approximately 14 days.
     img

OUR TECHNOLOGY WILL HELP YOU WITH

  • Identification of optimal speed
  • Determination of optimal dispersion and homogeneity
  • Detection of dosage elevations – even very small elevations are detected
  • Identification of off-spec batches (waste and contamination)

DO YOU HAVE ANY QUESTIONS? ASK US TODAY!