InSpectro X
Inline UV/Vis Spectroscopy for Polymer Extrusion
Shining a Light into the "Black Box" of Extrusion
In modern polymer extrusion, most process parameters — temperature, pressure, screw speed, feed rates — are already captured automatically and in real time. But there has long been a critical gap: product-specific data. Historically, these could only be obtained through manual sampling and offline laboratory analysis, a workflow that is discontinuous, delayed by several hours, and simply not available 24/7. This gap makes true real-time process and quality control impossible, creates a barrier to digitalization and AI-based data evaluation, and can lead to undetected short-term events in the extruder, unnecessary waste, increased costs, and even reputational damage from product rejects. InSpectro X — developed by ColVisTec AG in Berlin — closes this gap by bringing full UV/Vis spectroscopy directly into the molten polymer, with no sampling required.
How It Works — The Fundamentals
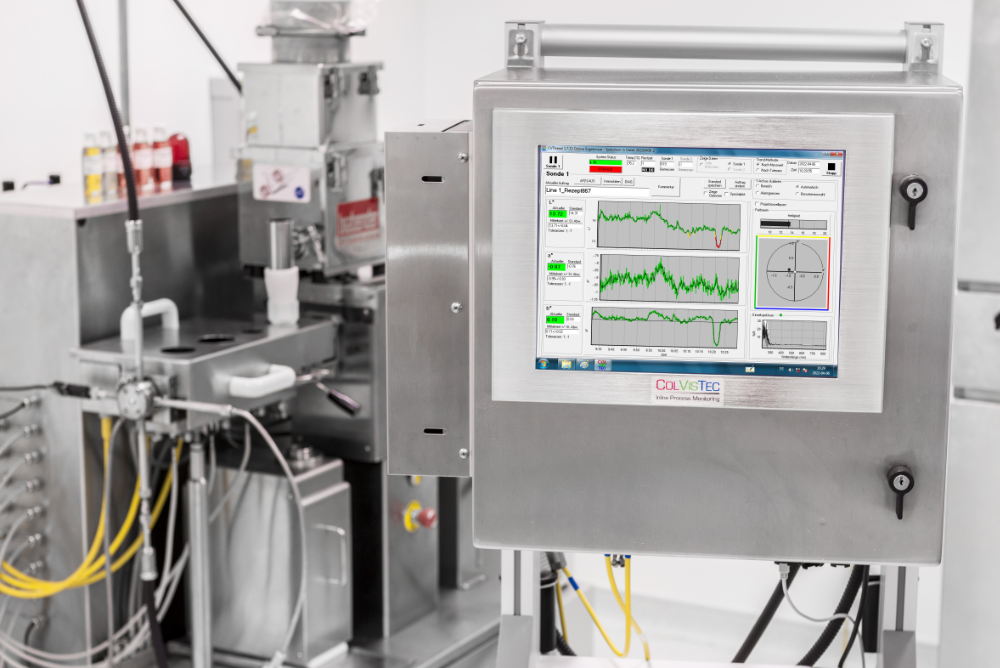
InSpectro X is an inline UV/Vis spectrophotometer designed specifically for the harsh conditions inside an extruder. The system consists of three core elements:
- A robust fiber-optic probe with a sapphire half-spherical window at its tip, engineered to withstand up to 400 °C (752 °F) and 250 bar (3,625 psi) — conditions under which conventional lab probes would simply fail.
- Flexible optical fibers connecting the probe to the spectrometer, with cable runs of up to 100 meters (328 ft), enabling dual-point measurements or even parallel monitoring of two extrusion lines from a single instrument.
- The InSpectro X spectrophotometer unit itself, integrated in a NEMA4 (IP66) stainless steel enclosure with a touchscreen panel PC, built to tolerate the dust, vibration, and ambient temperature swings of a production environment. A thermoelectric cooling/heating device keeps the internal temperature constant for stable measurement performance.
Color Monitoring & Quality Control
Color is one of the most sensitive, information-rich quality indicators in polymer processing. Every parameter in the production line — temperature, pressure, throughput, feeder behavior, pump stability, raw material lot variation — ultimately leaves a fingerprint in the color of the melt. Traditionally, color is verified offline, and the procedure is slow:
- Pull a sample from the process
- Transport it to the lab
- Shape it into a measurable plate or chip
- Cool to room temperature
- Measure on a lab spectrophotometer
- Report back to production
- Decide on a process adjustment — and potentially repeat the entire cycle
The time between sampling and result can span several hours, and the single data point tells you nothing about what happened before, during, or after the sample was taken. InSpectro X eliminates the first six steps entirely. Measurements are performed directly in the melt, in real time. From each spectrum, the system calculates and trends standard CIE color values — L*, a*, b*, C*, h, dE*, along with industry indices such as Yellowness Index (YI) and Whiteness Index (WI). Trend charts visualize every deviation as it happens, and the measurement frequency is freely adjustable up to 4 measurements per second for high-resolution process tracking. Calibration is designed for production use and can be performed without interrupting the process.
The benefits over offline sampling are immediate:
- Real-time information on process stability and product quality
- Automatic detection of off-specification material
- Controlled start-up, color changes, and end-of-run phases
- Detection of pulsing pumps, feeder drift, and dosage variations
- Automated color control in recycling applications
- Complete 24/7 documentation that can be shared with customers as a traceable production log
- Significantly reduced waste and a higher return on investment
Beyond Color — API Detection and PAT for Hot Melt Extrusion
In pharmaceutical Hot Melt Extrusion (HME), the same inline UV/Vis platform becomes a powerful Process Analytical Technology (PAT) tool,
fully aligned with Quality by Design (QbD) principles.
InSpectro X has been successfully applied to the most widely used pharmaceutical polymers
— Kollidon® VA64, Soluplus®, Affinisol™, Plasdone™, HPMCs, EVA, and Eudragit™ —
in both transparent and opaque states. In HME, three factors dominate degradation kinetics:
screw speed, screw design, and barrel temperature. Inline UV/Vis monitoring reveals the degradation
signature of each in real time, allowing the optimal operating window to be
identified quickly rather than through lengthy offline trials.
Beyond polymer stability, the system can also act as a direct detector for Active Pharmaceutical Ingredients (APIs).
In trials with paracetamol in EVA at 2 kg/h throughput, the optical signal at both 380 nm and 680 nm showed an excellent
linear correlation with paracetamol dosing rate (R² = 0.9997 and 0.9989, respectively), making it possible to:
- Determine the optimal feed rate for a given API concentration.
- Verify API content in the polymer in real time.
- Immediately flag feeder failures or bridge-building in the hopper — cases where the nominal feed rate is correct but no API is actually reaching the melt.
Characterizing the Extruder — Inline Spectroscopy in R&D
For R&D teams and process development engineers, InSpectro X is more than a quality tool — it is a window into extruder dynamics that replaces slow, cumbersome methods (like the traditional ash method for residence time) with direct, high-resolution measurement. Joint studies with Leistritz Extrusionstechnik GmbH on a ZSE 18 MAXX twin-screw extruder demonstrated several core R&D use cases:
- Residence Time Distribution (RTD). With measurement intervals as short as 500 ms (up to 4 Hz), a single tracer pulse produces a complete, high-resolution RTD curve in minutes — no pellet collection, no ashing, no waiting. The system even includes built-in Residence Time Analysis (ReTA) and Residence Time Measurement (RTM) tools that turn automated measurements into visualized results in just three clicks.
- Screw Configuration Optimization. Running the same recipe through different screw configurations at multiple speeds reveals immediately which configuration delivers clean dispersion and homogenization and which produces uneven, inhomogeneous output. What used to require batch-by-batch offline analysis becomes visible as a live trace on screen.
- Speed Window Definition. Sweeping through concentration levels and screw speeds, the L* trends make it clear when a speed is optimal (overlapping, smooth curves indicating perfect dispersion) and when it is too aggressive (noisy, diverging curves indicating loss of homogeneity). Operating windows for each recipe can be defined quantitatively rather than by feel.
- Impact of Throughput and Dosage Changes. Step changes in feed rate or throughput are immediately visible as shifts in the optical signal, allowing engineers to quantify the impact of each process change — and to detect drifts, pulsations, or contamination events the moment they occur.
Technical Data
- Spectrum (reflection): 380 nm through 780 nm
- Spectrum (transmission): 230 nm through 820 nm (optional)
- Resolution: 1 nm
- Monochromator: Grating monochromator
- Number of Beams: 4 channels: 2 measurement & 2 reference channels. Up to 2 probes simultaneously.
- Measuring time: 10 ms
- Frequency of measurements ("sampling"): 2s or more (freely adjustable depending on the process needs)
- Light source: 2 independent Xenon flash lamps (one for each probe with flash control)
- Calibration: white ceramic tile and black trap + green check standard
- Color Scales: CIE-L*a*b*, CIE-L*C*h, CIE-94, CIE-2000, CMC (l:c), FMC, HunterLab, XYZ, xyY
- Other Indexes: whiteness CIE, whiteness E313, yellowness D1925, yellowness E313
- Illumination: A, C, D50, D65, F2 (CWF), F11 (TL84) (other options available upon request)
- Box: Stainless Steel
- Degree of Protection: NEMA 4X (IP66)
- Temperature regulation: Enhanced Thermo-Electric Heating and Cooling device (TEHC)
- Dimensions (mm): 610 (W) x 550 (D) x 850 (H) - inlcuding standard support and TEHC
- Weight: 90 kg (InSpectro X alone ca. 55 kg)
- Required space: approx. 1m x 1m
- Integrated computer with 128 GB SSD and integrated touchscreen
- Operating system: Windows® 10 IOT Enterprise LTSC
- Interfaces: 3x USB, 1x Ethernet, OPC-UA (server provided)
- Optional interfaces: Serial with Modbus RTU/TCP/UDP
- Voltage: 230 V, 50 Hz, 3 A (EU) or 120 V, 60 Hz, 8 A (US)
- Environment conditions: 5 °C (41 °F) to 40 °C (104 °F) (non-condensing)
Included Software: CVTrend - licensed inline user software for continuous process monitoring.
Optional Softwares:
- ReTa – for residence time distribution analysis
- RedLog – for quick and easy color values data analysis and insights
- SpecViewer – for advanced spectral data analysis